Navigational charts have been used since the technology of paper was invented in Asia and the Mediterranean and combined with seafaring. The ancient Greeks had charts of the coastline around the Mediterranean Sea. It was essential for the rulers in the city states to send ships or fleets to the correct place in times of war or conquest. During the Ming Dynasty there was a vast fleet of trade vessels that sailed all the way to East Africa. Sections of their charts were later used by the Portuguese to explore the Indian Ocean.
Paper charts are legal documents that are kept aboard a ship for years and used where navigation is repeated. They will show the depths of the ocean, the coastlines of islands and landmasses, where seaweed can be found and even where large scale ocean currents will be encountered. Courses are overlaid with pencil, triangles, and dividers to plot the proper approach and route. Chart corrections are made when a new pinnacle or rock is found, or aid to navigation is changed. Electronic charting systems have exploded in the last ten years, revolutionizing navigation aboard ocean-going vessels. With the advent of Global Positioning Systems (GPS) and computing power, electronic charts can integrate readings from different sources and provide the navigator with a vast amount of information. Whereas before the navigator would have to collect information from many sources using different technologies—the speed of the vessel, the location of the vessel, the speed of the wind, the local tide changes, the local currents; now all those sources are directed to one screen and show how they affect the movement of the vessel and its location over the course of the voyage so the same course can be followed repeatedly.
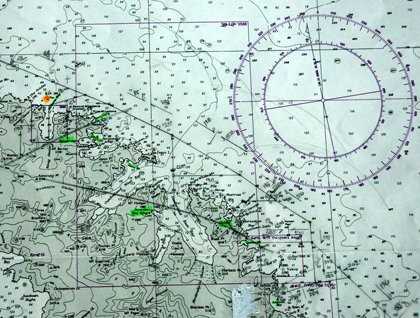
On National Geographic Explorer we use both paper (a section of South Georgia is shown) and electronic charts (a snapshot of our electronic plotter as we sail to the southeast). As powerful a tool as the electronic plotter is, information overload is a real phenomenon that can affect mariners in the throes of a challenging situation where instantaneous decision making can have negative consequences. The trust in the feel of paper and the connection of the eye looking out the bridge window and then down to the frayed coffee-stained chart is immediate, simple, and clear, being uncluttered by numerous rows of ever-changing numbers and colors.
As we sail from South Georgia towards the Antarctic Peninsula we are reminded of Captain Cook, who plied these waters and made the first charts of this area and ultimately circumnavigated the entire continent of Antarctica never having confirmed its existence. Would he have been more successful with an electronic chart? In actuality probably less so if he had relied on it instead of his honed sailing skills.


.jpg?width=106&height=85&mode=crop&scale=both&quality=50)